

Production
Allocated Daily Oil
bbl/d
Allocated Daily Gas
Mscf/d
Allocated Daily Water
bbl/d
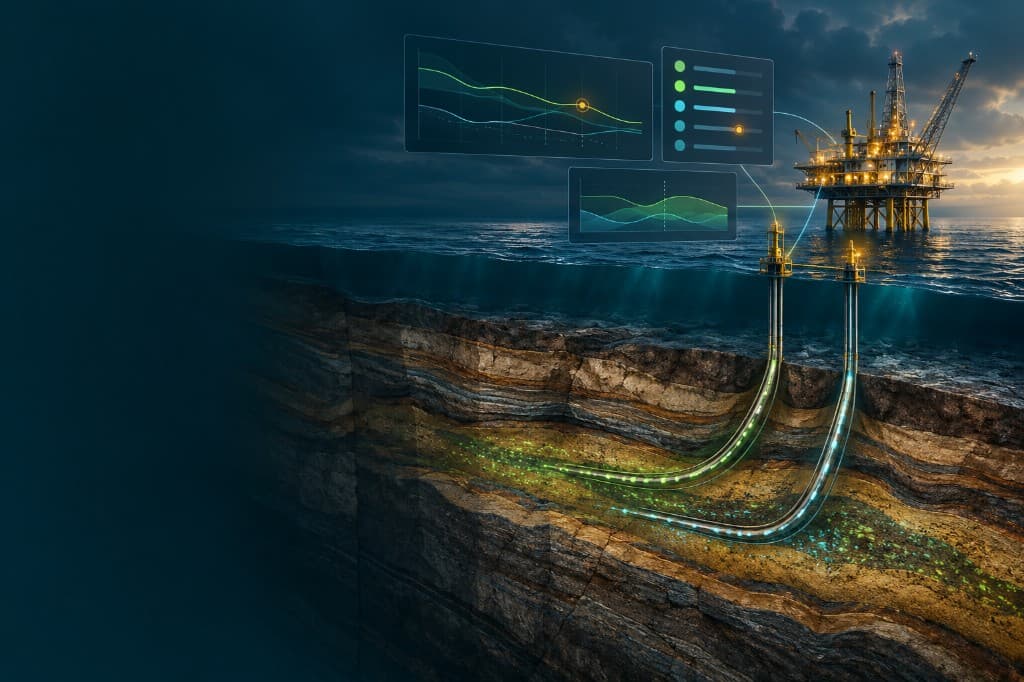
Flow iQ enables organizations to automatically monitor their assets, alerting them to issues that require attention so they can proactively resolve problems and maximize asset value.
Well Navigator · Plot · Indicators
Flow iQ Dashboard
Well Navigator, well information, plots, monitoring indicators, KPI summary, and a real-time production snapshot.
The Flow iQ Dashboard offers a detailed overview of essential information from the Flow iQ application. It includes the Well Navigator, a well information window, a plot section, and a quick overview of monitoring indicators. Additionally, it features a summary of key performance indicators (KPIs) and a real-time snapshot of production, with space allocated for any additional information as needed.
Well Navigator
Well information window
Plot section
Monitoring indicators
KPI summary
Real-time production snapshot
The well data book contains essential information about the well that is critical for determining its performance. The data is presented in a tabular format.
Date · Datestamp
Production
Pressure
Performance
Allocated Daily Oil
bbl/d
Allocated Daily Gas
Mscf/d
Allocated Daily Water
bbl/d
Static Bottom Hole Pressure
psi
Flowing Bottom Hole Pressure
psi
Tubing Head Pressure (THP)
psi
Well Head Pressure (WHP)
psi
Drawdown
psi
Productivity Index (PI)
bbl/psi
Pseudo Skin
Wellbore Gradient
psi/ft
Friction Drop
psi
Choke Size
The Flow iQ Well Data Book can import parameter data from Excel, CSV, JSON, and TXT files. Additionally, data available in Petroleum Engineering Software, such as PROSPER, can also be imported by the application.
→ Flow iQ Well Data Book
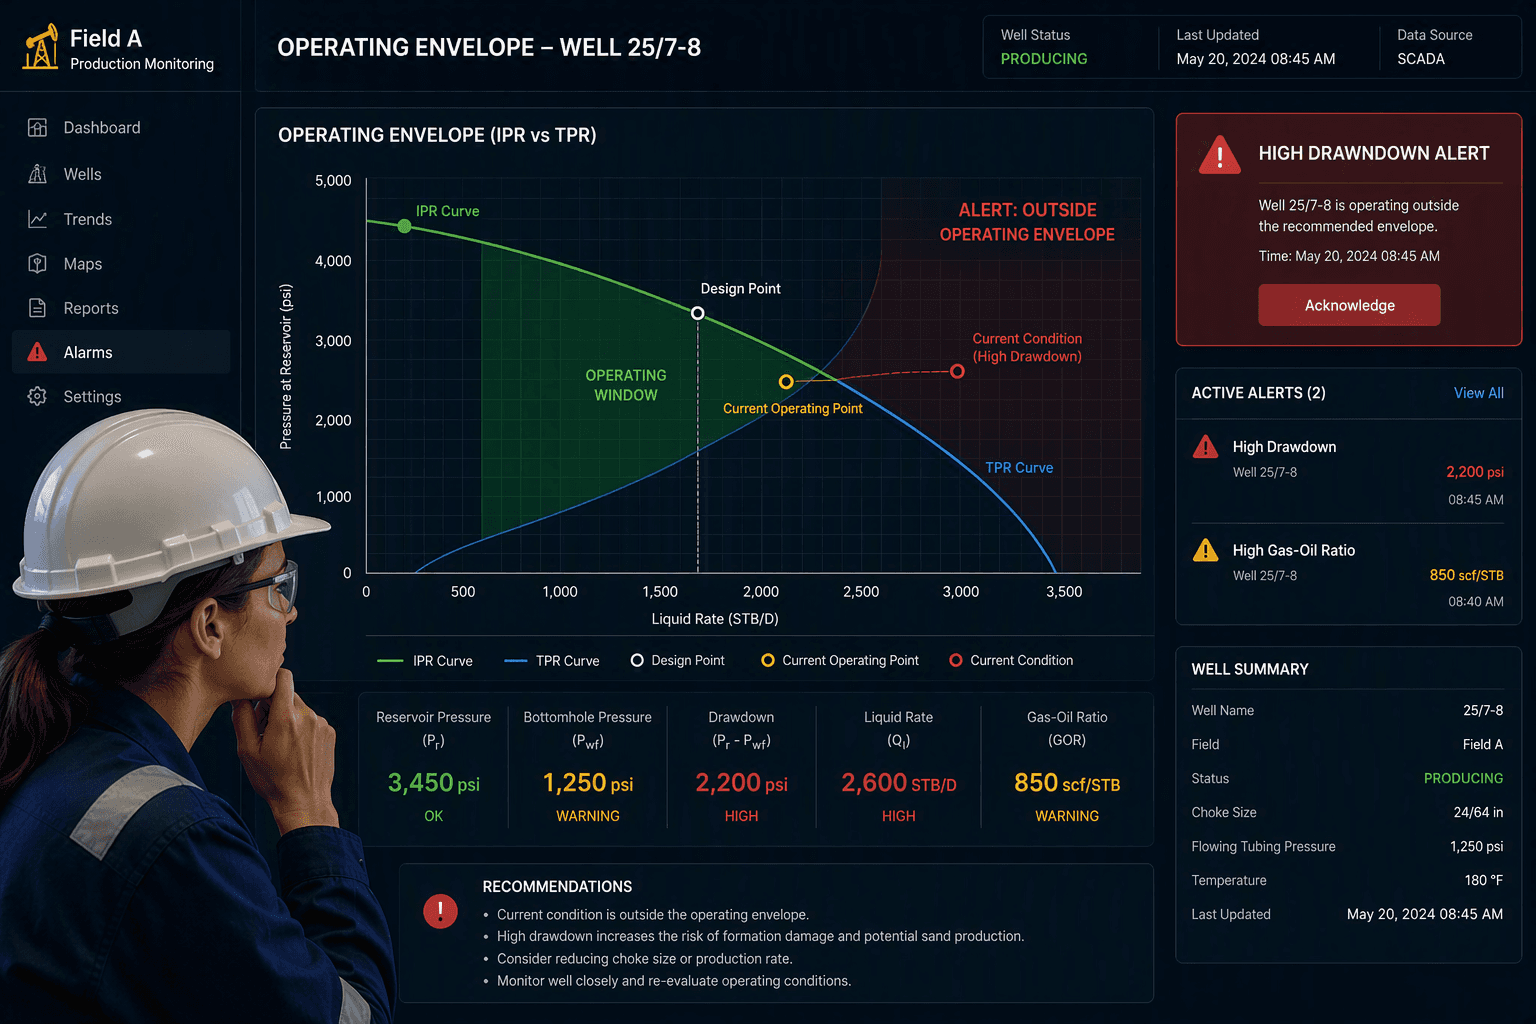
The "Flow iQ Well Book Record - Operating Envelope" contains the surveillance record for each well, providing users with insights into the wells' performance. It highlights critical issues and enables users to plan necessary interventions.
The Flow iQ Temperature-Derived Rate Module enables real-time performance optimization by utilizing temperature-derived rates to prevent declines in productivity. With this module, we can convert measured well temperatures into accurate production rates using data-driven models that correlate temperature to rate.
These temperature-derived rates have demonstrated a high level of accuracy, matching well tests, multiphase meters, and ultrasonic meters within ±3% error, making them suitable for daily monitoring and real-time decision-making.
Additionally, continuous temperature data can effectively replace intermittent rate measurements for performance surveillance.
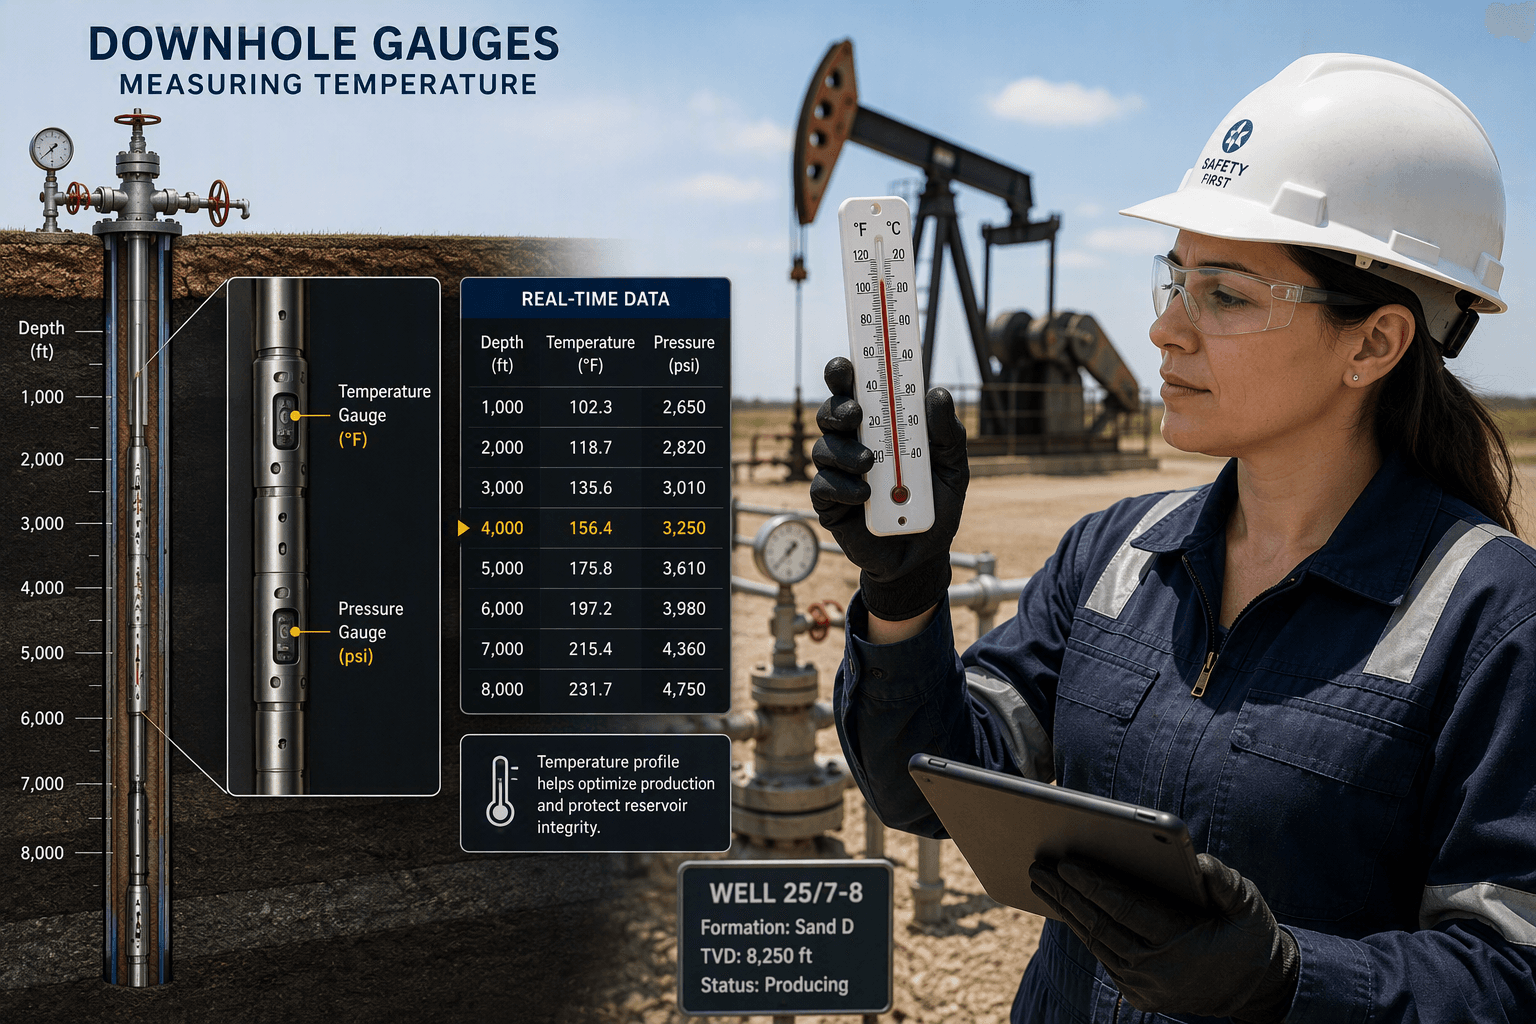
Measured temperature
Data-driven correlation
Estimated production rate
Performance surveillance
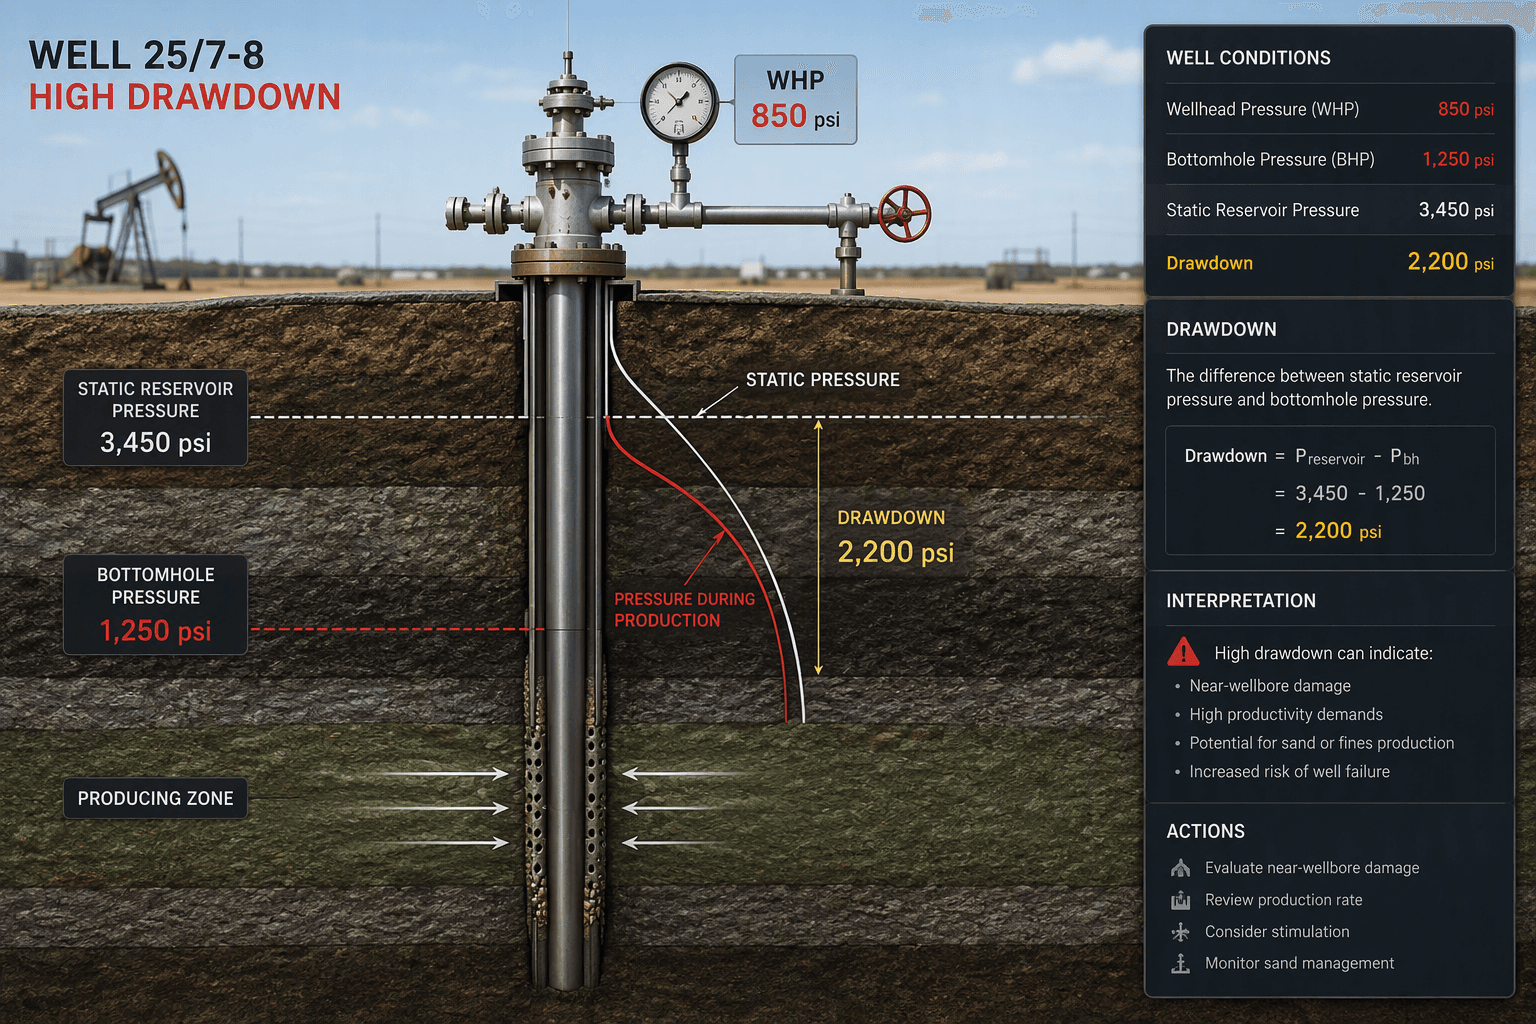
The Flow iQ platform utilizes temperature-derived rates or multiphase rates along with real-time surveillance plots to identify the maximum sustainable drawdown limit. This limit represents the point at which productivity decline accelerates.
By doing so, operators can work right at the edge of optimal performance without entering conditions that cause damage. With the Flow iQ Maximum Sustainable Drawdown Module, optimal operating limits can be dynamically identified rather than being statically assumed.
Flux represents the average velocity through the screen. Flow iQ developed the Flux calculation because it is the primary risk factor for screen erosion. Relying on drawdown alone is an unreliable safety metric. It is possible to optimize production while maintaining well integrity when Flux is managed effectively.
ETE-Optimiza's Flow iQ monitors several key trends, including Flux over time, rate versus effective area, pressure loss versus rate slope, and sand indicators (both surface and desanders). Additionally, it observes step-change behaviors during choke adjustments. Monitoring these trends is crucial because deterioration in the Flux trend serves as an early warning signal—well before any potential failure occurs.
Lite PTA excels in surveillance and performance tracking, while long-term PTA remains essential for reservoir characterization.
Objectives that are well-suited to ETE-Optimiza's short tests include skin, near-wellbore damage, completion effectiveness, and productivity comparison before and after workovers.
Conceptual curves. Long-term PTA remains the tool for reservoir characterization.
1 hr
24 hr
48 hr
Using 1-hour, 24-hour, and 48-hour routine shut-ins with high-quality downhole pressure data, ETE-Optimiza's Pseudo Skin Surveillance system obtains reliable skin and productivity diagnostics—without running a classical long well test—exactly as enabled.
The main objectives of generating a Pseudo Skin using Lite PTA are to assess skin and near-wellbore conditions, as well as to evaluate changes in productivity compared to the last surveillance. It's important to note that determining reservoir boundaries is explicitly excluded from this process. This approach is feasible because routine platforms and well shutdowns take place every few months.
The skin obtained through this method is deemed reliable because it primarily reflects early-time responses. During this early time, pressure readings are clear and exhibit low noise, as the gauge is positioned close to the perforations. Additionally, this objective aligns well with the capabilities of short-duration tests.
Request a pilot to review Flow iQ with the ETE-Optimiza team.